Overview
Much has been learned over the last 20 years regarding good and bad industrial HMI design practices. What we now know to be good design practices have come from a variety of sources, including:
HMI deficiencies made apparent by accidents, with resulting in-depth analysis
Information from academic research.
Information from research by other industries such as aviation and computer programming.
Advances in technology and new capabilities of modern HMI systems.
In this chapter, we distill these learnings down to a fundamental set of principles which, when put into practice, provide for the design of High Performance HMIs. These principles become the rules which guide the development of all aspects of the operator HMI, from the various types and overall layout of the graphics in the operator’s console to the way a PID controller is represented on each type of graphic, as well as how the operator interacts with the graphic to make process changes.
We will take the principles learned here and apply them to create the various components which make up the operator graphic. The three primary principles are:
Clarity
Graphics are easy to read and intuitively understandable.
Graphics show the process state and conditions clearly.
Graphic elements used to manipulate the process are clearly distinguishable and consistently implemented.
Graphics do not contain unnecessary detail and clutter.
Graphics convey relevant information, not just data.
Information has prominence based upon relative importance.
Alarms and indications of abnormal situations are clear, prominent, and consistently distinguishable.
Consistency
Graphic functions are standardized, intuitive, straightforward, and involve minimum keystrokes or pointer manipulations.
The HMI is set up for navigation in a logical, hierarchical, and performance-oriented manner.
Feedback
Graphic elements and controls (objects) must behave and function consistently in all graphics and all situations.
Important actions with significant consequences will have confirmation mechanisms to avoid inadvertent activation.
Design principles will be used to minimize user fatigue, since operations personnel use the graphics constantly.
The goal is to provide the operators the information they need in a clear and intuitive format and in such a way minimizing the possibility of mistakes. Following these three principles will deliver this goal.
The following sections will take the primary principles of clarity, consistency, and feedback to develop design rules, which will result in graphics with the following attributes:
The operator’s attention is drawn to the most critical information.
Confusion and mistakes are eliminated by designing the HMI in a consistent, easy to read, intuitive manner with proper feedback.
Reaction time is optimized by providing the operator information needed in a simple, logically progressive, performance-oriented HMI display structure.
High Performance graphics are designed in a hierarchy for progressive disclosure of further detail and to handle specific tasks. It is far too common for HMIs to be “flat” and without hierarchy, which produces cluttered displays poorly suited to either normal or abnormal operations. A proper hierarchy for graphics is:
Level 1 – Process Area Overview
Level 2 – Process Unit Control
Level 3 – Process Unit Detail
Level 4 – Process Unit Support and Diagnostic Displays
The Process Pictorial – An Overused, Low-Performance Paradigm
Industrial projects have long used P&IDs as process design tools, which is their purpose. They pre-date display screens by many decades. A P&ID was never designed nor intended to be the basis for an HMI. They have no hierarchy, intentionally being a “flat” view of every element of the process, rather than supporting “drill-down” for additional information.
However, because of their availability, convenience, and visual nature, most of the displays now used throughout the process industries are little more than P&IDs with “live values” sprinkled on them.
This “process pictorial” paradigm is extremely widespread and tens of thousands of operators throughout the world use such displays every day. In many cases, they have been in use for almost two decades essentially unchanged. Entirely new displays following this old paradigm are being created every day and the people doing so believe they are doing a good thing. It has become the “default”. The result is sub-optimum performance.
We are not advocating the elimination of the process pictorial as an element of a high performance HMI. When done well (unfortunately all too rare an occurrence), it is a display element having a proper place and uses. However, it has severe deficiencies in many areas and there are more effective methods of displaying information to the operator.
A High Performance HMI cannot be achieved by replicating P&IDs on a display screen.
Recognizing Good and Bad Graphics at a Glance
High Performance Graphics should look boring!
A graphic optimally designed for running a process and handling abnormal conditions effectively will, in fact, look boring. Here are some examples of what we mean. This is where some readers will begin squirming in their seats…
Poor Graphics have:
No trends.
Big flashing flames showing when a burner is on.
Brightly colored process vessels rendered with 3-D shadowing, as well as 3D process lines and pumps.
Spinning agitators and pumps, moving conveyors, splashing liquids and sprayers, and other such animation elements.
Detailed depiction of non-changing internal elements of equipment.
Attempted color coding of process piping with their contents.
Measurement units (psig, gpm, etc.) spelled out in big, bright text.
Liquid levels in vessels displayed in bright colors the full width of the vessel.
An exact representation of the P&ID with minor connections and valves.
Lots of crossing lines.
Process flow from left to right, right to left, top to bottom, and bottom to top. There are a very few countries where right-to-left process flow depiction is used, matching the written language practices. However, this is not uniform.
Alarm-related colors used for non-alarm related elements.
Limited, haphazard navigation from screen to screen.
Inconsistent color coding of various elements.

Figure 1: An example graphic violating many of the principles for a High Performance HMI
When looking at Figure 7-1, you can see it is quite flashy in appearance and devotes much detail to the depiction and labeling of non-changing, internal elements of the boiler. The room’s floor and wall have different textures and the boiler even has a shadow. The ductwork is highly polished. However, the process values used to control and monitor the boiler are depicted as small text with contrast problems. There are no trends or performance information of any sort. Possible control manipulations are not apparent. Color is used inconsistently and improperly. Much work may have gone into the creation of this graphic.; that work has been wasted. Previously shown Figures 2-3 and 3-2 are similar examples of poor design.
Graphics like these might look great and impress the children visiting the control room on career day, but the operators using them every day are being provided a very poor set of tools to accomplish their primary job – operating the process safely and profitably.
High Performance Graphics have these characteristics:
Depiction of process status and values are made in the context of information rather than as simple numbers on a screen.
Important information and Key Performance Indicators have embedded trends.
There is no gratuitous animation, which includes no spinning agitators or pumps, moving conveyors, splashing liquids and sprayers, etc. Limited animation is used only to highlight abnormal situations.
Gray backgrounds are used to minimize glare, along with a generally a low-contrast depiction.
There is very limited use of color and alarm colors are used only to display alarms and nothing else. If yellow is an alarm color, then yellow is never used as a text label, line color, border, or any other non-alarm-related element.
Equipment is depicted in a simple 2-D low-contrast manner, rather than brightly colored 3-D vessels with shadowing.
Layout is generally consistent with the operator’s mental model of the process.
Logical and consistent navigation methods utilize a hierarchy for the progressive exposure of process detail.
Display access requires a minimum of operator keystroke actions.
Techniques are used to minimize the possibility of operator mistakes, as well as provide validation and security measures.
Display elements have consistent visual and color coding.
Gray process lines are used, with major lines shown slightly thicker.
A layout wherein the process flow is from left to right whenever possible. Gas should flow up and liquids flow down. Proper layout minimizes crossing lines.
A layout consistent with the operators’ mental model of the process. The operators may relate better to the physical plant layout than the layout as shown on a P&ID. They may always enter the process from the south, so an equipment layout as perceived from the south might be optimum.
Techniques are used to minimize the possibility of operator data entry mistakes and provide validation and security measures. For example, a graphic element pushbutton to initiate an infrequent shutdown action should include a step to confirm the operator intentions and allow for cancellation.
Measurement units should be shown in low contrast lettering, if used at all (the operators generally know the units of measurement.)
Data is Not Information!
There is a big difference between data and information. Most poorly constructed operator displays show a great amount of data, but little information. We have seen displays consisting of little more than the presentation of well over a hundred numeric values on a single screen. A display element, such as in Figure 2, is a typical “bad example.” The element shown is, unfortunately, a common example of process displays worldwide.

Figure 2: Displaying Lots of Data
Let’s illustrate the difference between data and information. Here are the results of a blood analysis of Fluffy, a pet cat. What can be determined from this information? Is Fluffy sick?

Figure 3: Fluffy’s Blood Test
The answer is, unless you are a veterinarian, you have no idea! Here is the same data, with a slight improvement:

Figure 4: Fluffy’s Blood Test – View 2
By carefully (and tediously) examining the above, you can get a slight idea as to whether each number is “good” or “bad” based on the position within the range – even without knowing what the individual values mean to feline physiology.
A much better presentation is as follows – where far less time is needed to understand the numbers:

Figure 5: Fluffy’s Blood Test – View 3
The graphical indicators give the information at-a-glance that Fluffy is OK. In fact, this depiction can be flashed on a screen for less than one second and people will clearly understand it. Information is data in context made useful. The individual numbers are not even needed as long as the indicators are in the proper range. A proper use of this technique “lines up” the indicators when everything is normal, which is a common practice for aviation engine instruments.
Analog is Often Better
The Douglas Adams novel, The Hitchhiker’s Guide to the Galaxy, refers to Earth as “an utterly insignificant little blue-green planet whose life forms are so amazingly primitive that they still think digital watches are a pretty neat idea.” (Great novel. Good British TV series. Terrible movie!)
Humans are analog beings. The world we live in is an analog world – all the way down to the quantum level. We understand many things most effectively when presented properly in an analog fashion. Some readers will remember when digital watches were first introduced. How cool they were! What excitement! Then the fad died down quite quickly because people actually do not care what time it is. What we care about is usually how much time we have between now and some other event. Your next meeting is at two o’clock. You make a split-second glance at your watch. Can you make the meeting?

Figure 6: Can You Make the Meeting?
The analog watch (even the cool but “distracting” one shown) is much more suited to the human ability to quickly interpret analog values. A conventional watch can show, in literally a small fraction-of-a second glance, “I have about 10 minutes until the meeting.” Interpreting a digital display of 1:48:58 takes longer and requires more mental effort.
The Bulova Accutron electronic tuning-fork-movement watch (1960-1977) was the height of pre-quartz watch technology. Transistors drove the coil (containing almost 300 feet of wire) at 360 hz (musically, F sharp – you could tune your saxophone to it.) Advertised as accurate to “one minute a month”, it became hugely popular. The see-through “Spaceview” was not designed for purchase, but as a jeweler’s model to explain the technology. Many customers wanted to buy it instead and it became the most popular version. If you are old enough to have seen the original run of The Man from U.N.C.L.E, you have seen many Accutron commercials – and some are still on YouTube. An Accutron movement regulated an experimental module left on the moon’s surface by Apollo 11. These watches are now highly collectible; the 1971 model shown ($180 originally) was an author’s high school graduation present – and still runs perfectly.
The rare Hewlett-Packard HP-01 electronic wristwatch (1977- 1980, originally $650 to $850) was a technological marvel in 1977, but a business failure. It was not only an LED chronometer, alarm, and calculator, but could also perform dozens of dynamic calculations based upon changing time, such as displaying the accumulating cost of a long-distance phone call (expensive in 1977). The younger readers of this book may not know early LED watches did not display continuously due to their high power drain; pressing a button was required to show the time. The HP01 had three batteries, two of which drove the display. The buttons were manipulated using a small stylus included in the wristband.
The HP-01 suffers from a poor HMI. Advanced functions require the buttons to be pressed in certain memorized sequences and the display feedback is highly limited. Similar situations are found when conventional 12-button telephones are equipped with advanced features via multiple “codes” and “switchook manipulations” that often frustrate the user.
Only 50,000 HP-01s were made and many were sold at steep discounts to HP employees. The ultimate in geek chic, these are also now highly collectable.
Hollywood movies consistently have major failings in the accurate depiction of technical information. However, the film industry is masterful at coming up with visual techniques to display crucial information, in literally a split-second of on-screen time. Here is an example many of us are familiar with – the sickbay medical readout from the classic 1960’s Star Trek:

Figure 7: “He’s not dead, Jim.”
This graphic panel could be displayed for only a second or two on screen, yet the viewer understood immediately the health of the patient via the moving triangular indicators. The small text did not have to be readable. The display was coupled with alarm sounds for out-of-proper-range values and the bars were color-coded with the healthy ranges. When the red-shirted crewman inevitably died, the indicators would sink slowly and sadly to the bottom. (It is rumored that one of the in-joke indicators was labeled “Remaining Medical Insurance.”)
Translated to an industrial situation, consider these alternative compressor display elements. These might be a piece of a larger graphic. The desire is to understand the nature of the operating performance at a single glance.

Figure 8: A Process Pictorial View of a Compressor
Compare the above traditional depiction to the following High Performance display element.

Figure 9: A High Performance View of a Compressor
Moving Analog Indicators
Figure 9 depicts moving analog indicators. With these, the operating status is visible at a single glance of a second or two. If all the indicators are inside the light blue bands indicating normal range, then there is no need to look at the compressor any further. The operator can proceed to survey the rest of the process for anomalies. In the element shown, two values have left the normal range, but not so far as to activate their alarms. This is clearly shown and assists in the desired aspect of detecting abnormal situations at early stages before alarms occur. The use of bar graphs instead of moving indicators may be easier to accomplish on some DCSs, but there are disadvantages to this method; when the values are low, the bars cease to show. Moving indicators are preferred.
Note also that the individual indicators show whether alarm ranges exist (for example, the vibration indicators have only high value alarms, not low alarms) and whether the measurement acts as an interlock initiator (the solid black rectangles at some of the endpoints).
Dynamic scaling of indicators like these can be used for different plant states, such as different feedstocks, products, or modes. Additional indication (Figure 7-10) can be made to show the value, direction, and magnitude of indicator movement for a defined time period.

Figure 10: Moving Analog Indicator Enhancements
Digital Controls
Imagine if instead of guiding your car with a steering wheel, you would instead type in a number from 0 to 360 degrees for each desired wheel position. Would you buy such a car? (Or more tellingly, would you insure one?) Analog is not old, obsolete, or out-of-date. Analog neatly matches human abilities and is very powerful!
Other Analog Depiction
As another example, consider these alternative distillation column temperature profile displays. The desire is to understand the nature of the profile at a single glance.

Figure 11: At-A-Glance Indicators – Column Temperatures
A correct profile can be seen at a glance as a straight line. Temperature values or deviation numbers can be programmed to appear/disappear with a toggle-type click. Digital numbers are displayed when accuracy is paramount.
The Importance of Trends
None of the examples above deal with a highly important aspect of operator displays – namely, trends. Trends are far underutilized in industrial displays. However, they are essential for properly presenting important data. Consider the following examples:

Figure 12: Data Needing a Trend
The display of the current value only shows “where I am now.” Even when coupled with the graphical indicator, the information is not optimal for managing many situations. Note how the trends below convey much more information about the nature of the process.

Figure 13: Trend Showing Slow Increase
The pressure had been stable at the desired 200 psig (dotted line), but began to rise at an even rate an hour ago. If this continues, it will reach the alarm point in a few minutes.

Figure 14: Trend Showing Oscillation
Here, the pressure has been oscillating around the desired value at about a 30 minute rate, but not getting up to the alarm point.

Figure 15: Trend Showing Prior Upset
Here, an upset about 90 minutes ago was over-corrected after the alarm. Now it looks like something similar might be beginning to happen again. A simple static display value would not convey any of this important information.
Proper Implementation of Trends
Trends are essential. Use lots and lots of trends!
Important values should be trended!. Now you may say, “But my DCS has the ability to pick any point and trend it if the operator wants to. Just select the value and hit the TREND button.” You would be right, they can. But they won’t though, not if it takes 10 or 20 keystrokes and mouse clicks to generate them. The actual series of keystrokes is often to hit the TREND button, and then select the proper scale, and then select the proper timebase, and then pick a color for the trace, and figure out what other things would be useful if displayed on that same trend, then decide if a multiple Y-Axis is needed because of different ranges, and then give the trend a cryptic name and save it, having forgotten that the same trend was built a month ago, and other operators on other shifts have built similar ones with other cryptic names and forgotten about them as well. Now this one trend is taking up an entire screen and the operator needs to look at something else Operators have different skill levels with the DCS functions and it’s our job to make sure the right tools are on the system so every operator can run the process effectively.
A much better solution than trending on-the-fly is to ensure every Level 1 and Level 2 graphic has, embedded in it, at least one trend of the important values associated with the operation. Multiple embedded trends are sometimes desirable. The information content of trends is far more valuable than the depiction of many typical “P&ID” elements on graphics.
Trends should be implemented with these capabilities and characteristics:
When the graphic is called up, the trend’s Y-Axis span should automatically range itself to a predetermined scale or a predetermined amount relative to the current value of the reading, such as +/- 2% or +/- 5 engineering units. The scale should rarely be the full scale of the value. It should be a tight scale where meaningful change of the value is immediately detectable. The scale span values should be shown and adjustable.
The trend should come up with a default timebase appropriate for the process condition (for example, to show the last 10 minutes, 2 hours, or the last 24 hours). This choice will vary based upon the particular process value being trended.
Normal process bounds, quality limits, or desirable operating range should be indicated based on the state of the process.
Manual alteration by the operator of the ranges and timebase should be possible and should persist to the next invocation of the display. A “Retrend” button should allow for the trend to return to the automatically-calculated values if the manually adjusted ones are no longer appropriate.
The operator should not have to manipulate any keys to make the trend usable.
The display of multiple traces should be consistently implemented.
Trends with either the y or x axis size at less than around 2 inches (perceived at arm’s length from the screen) are very likely too small to be effective.
Dedicated Level 2 displays consisting of only trends and faceplate access buttons to controllers associated with those trends should be provided for each process operation. The very best, most experienced operators will often run the process using primarily such displays. They do not need pictures of the distillation column showing each tray.
A proper trend of a controller will show process value, setpoint, and controller output. (As a good practice, the controller output trace should be available via toggle.) Such trends are highly useful for diagnosing controller problems and, particularly, valve problems. Studies have shown, unfortunately, on average :
More than 50% of all control valves are incorrectly designed with a nonlinear installed valve characteristic and/or incorrect sizing for the application.
More than 50% of all control valves have mechanical problems of hysteresis or stiction.
Almost 20% of control strategies can be improved upon.
10% to 20% of industrial control loops are run in manual.
About 33% of controllers produce more variability in auto than in manual (Bialkowski 1993; Deborough & Miller 2001; Desborough et al 2001; Ender 1993; Smuts 1999).
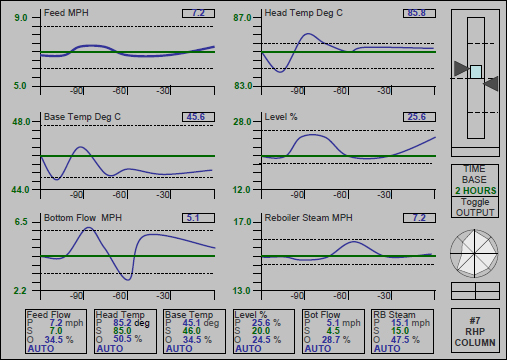
Figure 16: An “All-Trend” Level 2 Display with Access to the Relevant Process Controllers